Your best people may be disengaging, but you won’t know until they hand in their resignation letter. The warning signs were there. Declining participation, less initiative, a little more distance in every conversation. Without the right metrics in place, high-stakes retention decisions are made based on gut feelings and lagging indicators — and by the time the data catches up, the damage is done.
The right employee engagement KPIs can give you an early-warning system that lets you see what’s happening and act before it becomes attrition. Distributed and hybrid teams have made engagement harder to read. You can’t rely on observing energy in hallways or participation in office events to get a real picture of how your workforce is doing. Meanwhile, the cost of disengagement keeps climbing — hitting everything from customer satisfaction scores to your ability to attract top talent in competitive markets.
A structured approach to measurement changes that. The right KPIs surface early signals of teams at risk, give you proof that initiatives are working, and hand you the business case for continued investment in enhancing employee experience. This guide walks you through how to select, measure, and act on the engagement metrics that matter most — from eNPS and retention rates to digital engagement metrics and innovation indicators.
The difference between employee experience and engagement
Employee engagement and employee experience are often used interchangeably, but they measure different aspects of the employee-employer relationship.
Employee Experience
Employee Engagement
Measures touchpoints and systems
Measures emotional commitment
“What is the quality of my journey here?”
“How much do I care about this organization?”
Includes tools, workspace, processes
Includes motivation, advocacy, discretionary effort
Can be positive without high engagement
Requires positive experience as a foundation
What employee engagement measures
Employee engagement captures the emotional commitment and discretionary effort employees bring to their work. Engagement is what separates employees who complete their work from those who take ownership of it — who care about outcomes over outputs. Engaged employees are motivated by the company mission, willing to go beyond their job descriptions, and likely to recommend your organization to others.
Engagement KPIs help you measure:
Emotional connection to the organization’s mission and values
Willingness to advocate for the company as an employer
Discretionary effort and motivation to exceed baseline expectations
Sense of purpose and alignment with organizational goals
What employee experience measures
Employee experience (EX) encompasses every touchpoint an employee has with your organization — from the application process through offboarding. It includes the tools they use, the physical or virtual workspace, the quality of their manager relationships, and the cultural norms they navigate daily. Think of EX as the full journey, and engagement as how employees feel about that journey.
EX metrics capture:
Quality of onboarding, technology, and workplace resources
Effectiveness of communication and collaboration tools
Manager relationships and leadership accessibility
Career development pathways and learning opportunities
Why both employee engagement and experience matter
Poor EX — clunky systems, unclear communication, limited growth paths — will eventually erode engagement. But the reverse isn’t automatically true. An employee might love their workspace and tools yet feel completely disconnected from the company’s mission. Engagement KPIs are important because they predict the outcomes organizations care most about: retention, productivity, innovation, and advocacy. While we’ll touch on experience-related metrics that influence engagement — like training participation or internal mobility — the primary focus is measuring the commitment and connection that drive business results.
How to select the right employee engagement KPIs
The organizations that get the most value from engagement measurement are disciplined about what they track. They choose KPIs that align with business goals, drive action, and can be measured with available resources.
Tracking too many metrics creates confusion, dilutes focus, and overwhelms managers with data they can’t act on. The goal goes beyond comprehensive measurement to knowing what to with the data. When evaluating which engagement KPIs to track, look for metrics that meet below criteria.
A strong engagement KPI should be:
Measurable: You can capture it with current systems without manual data compilation
Actionable: It points to something you can influence and connects to business outcomes
Representative: It captures your entire workforce, not just a vocal subset
Benchmarkable: You can compare it against industry standards or past performance
Communicable: Executives and managers can understand it without a statistics degree
The KPIs you prioritize should map to your business challenges. An organization struggling with turnover needs retention rate and eNPS by department. One focused on innovation should track idea submission rates and cross-functional collaboration.
Modern employee experience platforms automate this measurement by pulling data from surveys, HRIS, and behavioral signals so you can track trends without administrative burden. This is valuable because one of the quietest threats to any engagement program is low survey response rates. When only your most frustrated or most enthusiastic employees respond, your data stops representing your workforce and starts representing the two extremes.
10 core employee engagement KPIs to track
These 10 engagement KPIs give you the data foundation to predict turnover, validate initiatives, and measure workforce commitment. Each metric reveals different aspects of engagement — from overall sentiment to daily behaviors — so you can spot patterns and intervene early.
KPI
Measures
Primary Insight
Employee net promoter score (eNPS)
Likelihood to recommend employer
Overall sentiment and employer brand strength
Pulse survey score
Real-time engagement sentiment
Early warning system for engagement shifts
Employee satisfaction score (ESAT)
Contentment with work experience
Individual happiness vs. organizational commitment
Retention and turnover rate
Employees who stay vs. those who leave
Talent retention success and cost of attrition
Internal mobility rate
Employees moving to new internal roles
Career growth and internal opportunity
Goal completion rate
Achievement of performance objectives
Alignment, clarity, and motivated execution
Recognition participation
Employees giving/receiving recognition
Culture of appreciation and peer acknowledgment
Digital engagement metrics
Intranet activity and content interaction
Daily workforce connection and information flow
Wellness and burnout indicators
Self-reported well-being and stress levels
Sustainable engagement vs. burnout risk
Employee advocacy and external brand mentions
Voluntary promotion on social media
Authentic employer brand strength
1. Employee net promoter score (eNPS)
eNPS measures overall employee sentiment by asking one simple question: “How likely are you to recommend this organization as a place to work?” This metric predicts Glassdoor ratings, referral quality, and even customer satisfaction, since engaged employees deliver better experiences.
How to measure eNPS:
Ask: “On a scale of 0-10, how likely are you to recommend [Company] as a place to work?”
Follow up: “What’s the most important reason for your score?”
Segment by department, tenure, manager, and location
Subtract the percentage of detractors (0-6 scores) from promoters (9-10 scores) to calculate your score — target above 20 as favorable, above 50 as excellent
Track trends over time rather than fixating on a single number — if your score drops quarter over quarter, investigate what changed. Benchmarks vary by industry, with tech companies typically scoring higher than retail or manufacturing.
2. Pulse survey score
Pulse surveys are short, frequent check-ins that track engagement in real time, catching shifts before they become turnover trends. Unlike annual surveys that provide a once-a-year snapshot, pulse surveys reveal whether recent changes like new leadership, restructuring, workload spikes are impacting engagement immediately.
How to measure pulse survey scores:
Deploy five to 10 questions monthly or quarterly on a consistent cadence
Ask: “I have the resources to do my job well,” “My workload is manageable,” “I understand how my work contributes”
Use a consistent 1-5 scale to track trends
Target: Average scores of 3.5-4.0 indicate solid engagement; scores below 3.0 are a signal worth investigating immediately
The trend matters more than the absolute number. A score dropping from 4.2 to 3.8 in one quarter deserves immediate attention, even if 3.8 seems acceptable.
If one team’s score dropped sharply after a reorg announcement, weekly check-ins might reveal confusion about new reporting lines rather than dissatisfaction with leadership. A targeted communication from the manager can then resolve it within weeks. Organizations that act on pulse data quickly — adjusting workloads, clarifying priorities, addressing manager issues — prevent small problems from becoming waves of resignations.
3. Employee Satisfaction Score (ESAT)
ESAT measures contentment with specific work aspects — compensation, workspace, benefits, work-life balance. While engagement measures commitment, satisfaction measures whether basic needs are being met.
You can have satisfied employees who aren’t engaged (comfortable but unmotivated) or engaged employees with lower satisfaction (committed despite frustrations).
How to measure ESAT:
Ask: “How satisfied are you with your current role?” “How satisfied are you with compensation?” “How satisfied are you with work-life balance?”
Use a five-point scale (very dissatisfied to very satisfied)
Segment by job level, department, and tenure
Target: 60-80% of employees rating 4-5 on satisfaction dimensions
Watch for satisfaction patterns across tenure — a sharp drop at the six- to 12-month mark is a signal that onboarding isn’t setting people up for long-term success. And if employees are broadly satisfied but engagement scores remain low, you may have created comfortable complacency rather than genuine commitment.
4. Retention and turnover rate
Retention measures the percentage of employees who stay, while turnover tracks who leaves. The cost of getting this wrong is concrete: Research from the Work Institute states that replacing an employee costs roughly 33% of their base pay.
How to measure retention and turnover:
Pull headcount data from HRIS at start and end of each financial year
Calculate retention: (Employees who stayed / Total at start) x 100
Calculate turnover: (Employees who left / Average during period) x 100
Segment by voluntary vs. involuntary, department, performance level
Target: Industry varies (3-4% monthly average), but track regrettable turnover specifically
Watch for leading indicators that predict turnover three to six months early. These include declining pulse scores, reduced participation in optional activities, and decreased internal network activity. Organizations that track these signals alongside turnover data can intervene before resignation letters arrive.
5. Internal mobility rate
Internal mobility tracks employees who move into new roles within your organization — promotions, lateral moves, or cross-functional transfers. High mobility signals growth opportunities and proves managers support career development rather than hoarding talent. Low mobility means people must leave to advance their careers.
How to measure internal mobility:
Track role changes in HRIS by filtering internal moves vs. external hires
Calculate: (Employees who moved internally / Total employees) x 100 annually
Segment by whether moves are promotions, lateral transfers, or project rotations
Target: 10-20% annually; below 5% is a signal that career paths may not be visible or accessible enough
LinkedIn data shows that employees who move into new jobs internally are 3.5x more likely to be engaged than those who stay in their current jobs. And employees stay 41% longer at companies that have a lot of internal hiring than those that don’t.
Organizations that see the highest mobility rates tend to share open roles internally before posting externally, build clear career frameworks, and reward managers for developing talent rather than retaining it. The alternative plays out behind the scenes: A strong performer realizes the only way to get a new title is to change companies, so six months later you’re backfilling their role.
6. Goal completion rate
Goal completion rate reveals whether employees have clarity on priorities, whether goals are realistic, and whether they’re motivated to execute. Low completion might indicate misaligned goals, resource constraints, or disengagement — not just poor performance.
How to measure goal completion rate:
Pull goal data from performance management or project management systems
Track: (Goals marked complete / Total goals set) x 100 per quarter
Segment by team, individual, and goal type (stretch vs. core)
Target: 70-80%, high enough to signal real progress, low enough to mean goals are genuinely stretching people
If 95%+ of goals are consistently met, they’re not ambitious enough. If completion falls below 60%, employees may feel overwhelmed or unclear about priorities. Teams with well-defined, measurable objectives report higher engagement because they understand how work contributes to organizational success.
7. Recognition participation
Recognition participation measures how often employees give or receive acknowledgment through formal programs, peer shout-outs, or manager praise. High participation means people feel seen and are willing to make others feel that way too. Low participation suggests recognition feels forced, infrequent, or reserved only for major achievements.
How to measure recognition participation:
Track activity in recognition platforms or intranet
Monitor: (Employees who gave or received recognition / Total employees) x 100 per quarter
Count both formal awards and informal peer recognition
Employees who receive recognition at least monthly are significantly more likely to stay and report higher satisfaction. Authenticity is more important than frequency — specific, timely acknowledgment tied to company values moves engagement scores in ways that generic praise (“Thanks for your hard work!”) simply doesn’t.
8. Digital engagement metrics
Digital engagement tracks how employees interact with your intranet, internal communications, and collaboration tools. These behavioral signals reveal whether people feel connected, whether they’re accessing needed information, and whether they’re participating in company culture — all without requiring a single survey response. That makes digital engagement one of the most honest signals on this list — you’re measuring what people actually do, not what they say.
How to measure digital engagement:
Monitor intranet page views, unique visitors, time spent, and return visit frequency. Most intranet platforms surface these natively in an admin dashboard.
Track content consumption patterns such as which announcements, resources, or leadership updates get engagement and which get ignored.
Track participation rates in town halls, discussions, and optional company events. Note both attendance and active contribution.
Benchmark active users monthly. Aim for 70%+ of employees logging in at least once a week. Below 50% suggests either an accessibility issue or a relevance problem worth investigating
Segment by team. A department consistently below average on digital engagement often has a communication gap, not an attitude problem
Declining intranet usage often precedes survey score drops by several weeks, making it one of the more reliable early warning signals in this list. If digital engagement is falling among a specific group — remote employees, a recently restructured team, a new office location — that’s your cue to check in before the pulse survey tells you something’s wrong.
9. Wellness and burnout indicators
Wellness indicators measure employee well-being, stress levels, and sustainable pace. These metrics tell you whether engagement is authentic or whether it’s depleting your people. High engagement scores and building burnout can coexist, especially in mission-driven organizations where employees feel too committed to slow down.
How to measure wellness and burnout:
Ask in pulse surveys: “My workload is sustainable,” “I can disconnect from work when needed”
Track self-reported stress: “How often do you feel overwhelmed by work demands?”
Monitor PTO usage rates, after-hours communication patterns, and wellness benefit utilization
Target: 60%+ agreeing with sustainable workload statements; a steady decline in PTO usage is one of the clearest early signals of burnout risk
The goal is long-term commitment over short-term intensity. Tracking wellness alongside engagement scores helps you tell the difference before people hit a wall.
10. Employee advocacy and external brand mentions
Employee advocacy measures how often employees voluntarily promote your organization externally through social media, reviews, referrals, or public recommendations. Engaged employees don’t just do a great job — they recruit others, defend your reputation, and amplify your message in ways marketing can’t buy.
How to measure employee advocacy:
Monitor Glassdoor and LinkedIn reviews for volume, sentiment, and themes
Track social media mentions and how often employees share company content
Measure employee referral participation and hire rates from referrals
Organizations with a strong employer brand can reduce the cost per hire by 50% and reduce turnover by 28%, according to a report by LinkedIn.
External brand mentions can be an early warning system in their own right. A sudden drop in Glassdoor ratings sometimes surfaces before internal pulse scores shift. If you’re seeing movement externally, it’s worth checking what’s happening internally.
How to make employee engagement KPIs work
The real value of engagement KPIs is what you do with the numbers. Organizations that excel at engagement act faster, target interventions more precisely, and demonstrate clear ROI.
Converting insights into outcomes requires three things: responding quickly, designing targeted interventions, and connecting improvements to the business metrics leadership cares about.
When scores shift, respond with a specific action:
eNPS drops 10+ points in a team: Manager conducts stay interviews within two weeks to understand root causes
Pulse scores on workload fall below 3.0: Department leader reviews priorities, cancels low-value meetings, and redistributes work
Recognition participation under 40%: HR launches targeted campaign explaining program and modeling peer appreciation
Digital engagement declining among remote workers: Audit communication accessibility and schedule virtual town hall to reconnect
Retention rate drops 5% quarter-over-quarter: Executive team investigates compensation competitiveness, manager effectiveness, and career development gaps
Best practices that drive sustainable improvement
Rapid response handles the immediate fires. But the organizations that consistently improve engagement over time build the habits and systems that make good responses the default, not the exception. These principles are what separate teams that react to engagement data from those that actually change because of it.
1. Segment data to design targeted interventions
Don’t launch organizationwide programs for problems that exist in specific pockets. If new hires disengage at six months, fix onboarding. If one department’s scores lag, investigate manager quality or workload distribution for that particular team. Broad solutions applied to narrow problems waste resources and signal to employees that leadership isn’t paying close enough attention.
2. Equip managers with action playbooks
Managers are closest to the problem and closest to the fix. Give managers dashboards showing their team’s scores plus specific guidance on what to do with them. Low goal completion rates trigger priority-setting workshops. Declining pulse scores prompt one-on-one conversations about roadblocks and support needs. Without that guidance, even well-intentioned managers don’t know where to start.
3. Close the feedback loop visibly
After every survey, communicate what you heard, what you’re changing, and how you’ll measure progress. This step is where most engagement programs fail. Employees who see their feedback drive action continue participating. Those who hear only silence stop engaging with measurement entirely. Aim to share themes within two weeks, implement changes within 30 days, and report progress within 60.
4. Connect engagement to business outcomes
Engagement data lands differently in the boardroom when it’s attached to numbers that leadership already tracks. Show that teams with high eNPS save $X in recruiting costs through better retention, deliver projects Y% faster, or achieve higher customer satisfaction scores. That’s how you make the business case for continued investments in employee experience technology and initiatives.
5. Measure the impact of interventions
After implementing changes, track whether relevant KPIs improve. If you redesign onboarding to boost new hire retention, monitor six-month turnover rates and pulse scores. If the needle doesn’t move within a quarter, that’s useful data too. It means either the intervention missed the root cause or the change hasn’t had enough time to register.
6. Make insights accessible in real time
Data that sits in a quarterly report isn’t actionable. Push insights to the people who can act on them — managers, team leads, HR business partners. Provide dashboards that update automatically and remove the lag between signal and response that lets small problems grow into big ones.
7. Celebrate wins and share learnings
When interventions work, publicize them internally. If one team’s recognition program boosts engagement scores 15%, share the playbook across the organization. Transparency about what’s working accelerates improvement across the company and signals to employees that the measurement system is real, not performative.
Common mistakes to avoid when measuring engagement
Even well-intentioned engagement programs fail when they fall into predictable traps. The mistakes below don’t just produce bad data — they actively damage trust with the employees you’re trying to understand. Avoid these mistakes to build a sustainable system that improves employee experience.
Avoid these common pitfalls:
Tracking too many KPIs: Start with five to seven metrics aligned to your biggest challenges — a focused dashboard that drives action beats a comprehensive one that overwhelms
Creating survey fatigue: Keep pulses to five to 10 questions, monthly or quarterly, and vary the focus so employees aren’t answering the same questions on a different cadence
Ignoring qualitative context: Pair quantitative KPIs with open-ended responses, focus groups, and stay interviews to understand root causes before designing interventions\
Collecting data without action: Employees who share feedback and see zero response become cynical, and cynical employees can be the hardest to re-engage
Missing critical patterns in averages: Always segment by manager, department, tenure, and role level to spot hidden crises before they sprea
Not sharing results with employees: Share aggregate results transparently, acknowledge challenges, and outline what’s changing in order to cultivate trust
Seeking feedback only once a year: Check in with employees at regular intervals and after significant changes so you have real-time data and can take any necessary action on survey results
Stop guessing and start measuring what matters
These 10 KPIs aren’t meant to be tracked all at once. Start with the four or five that map most directly to your biggest challenges right now. If turnover is the most urgent problem, anchor on eNPS, retention rate, and pulse survey scores. If you’re trying to build a stronger internal culture, focus first on recognition participation and internal mobility.
Pick the metrics that will give you the clearest signal on what you most need to understand, then build upon those. From there, the work is less about measurement and more about response time. The organizations that make an impact on engagement are the ones that act on data within weeks, not quarters. They close the feedback loop with employees, equip managers with specific guidance, and connect KPI shifts to business outcomes.
Measurement without action not only fails to improve engagement — it also actively erodes trust with the people you’re trying to retain.
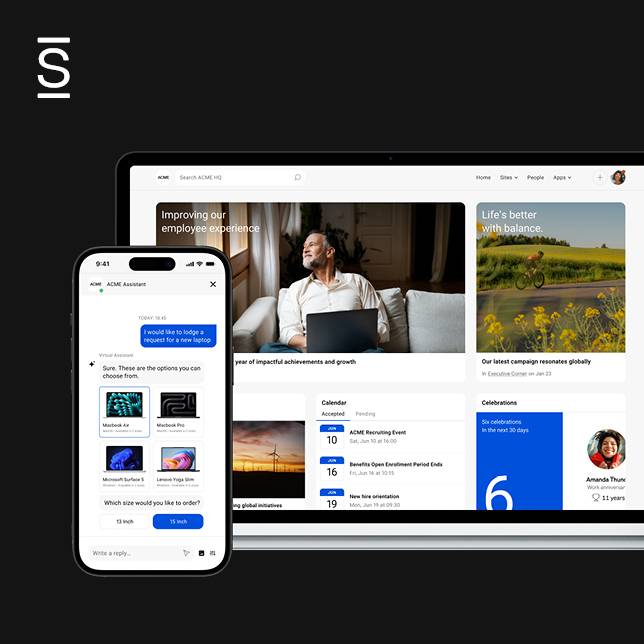
How Simpplr helps you measure and improve employee engagement
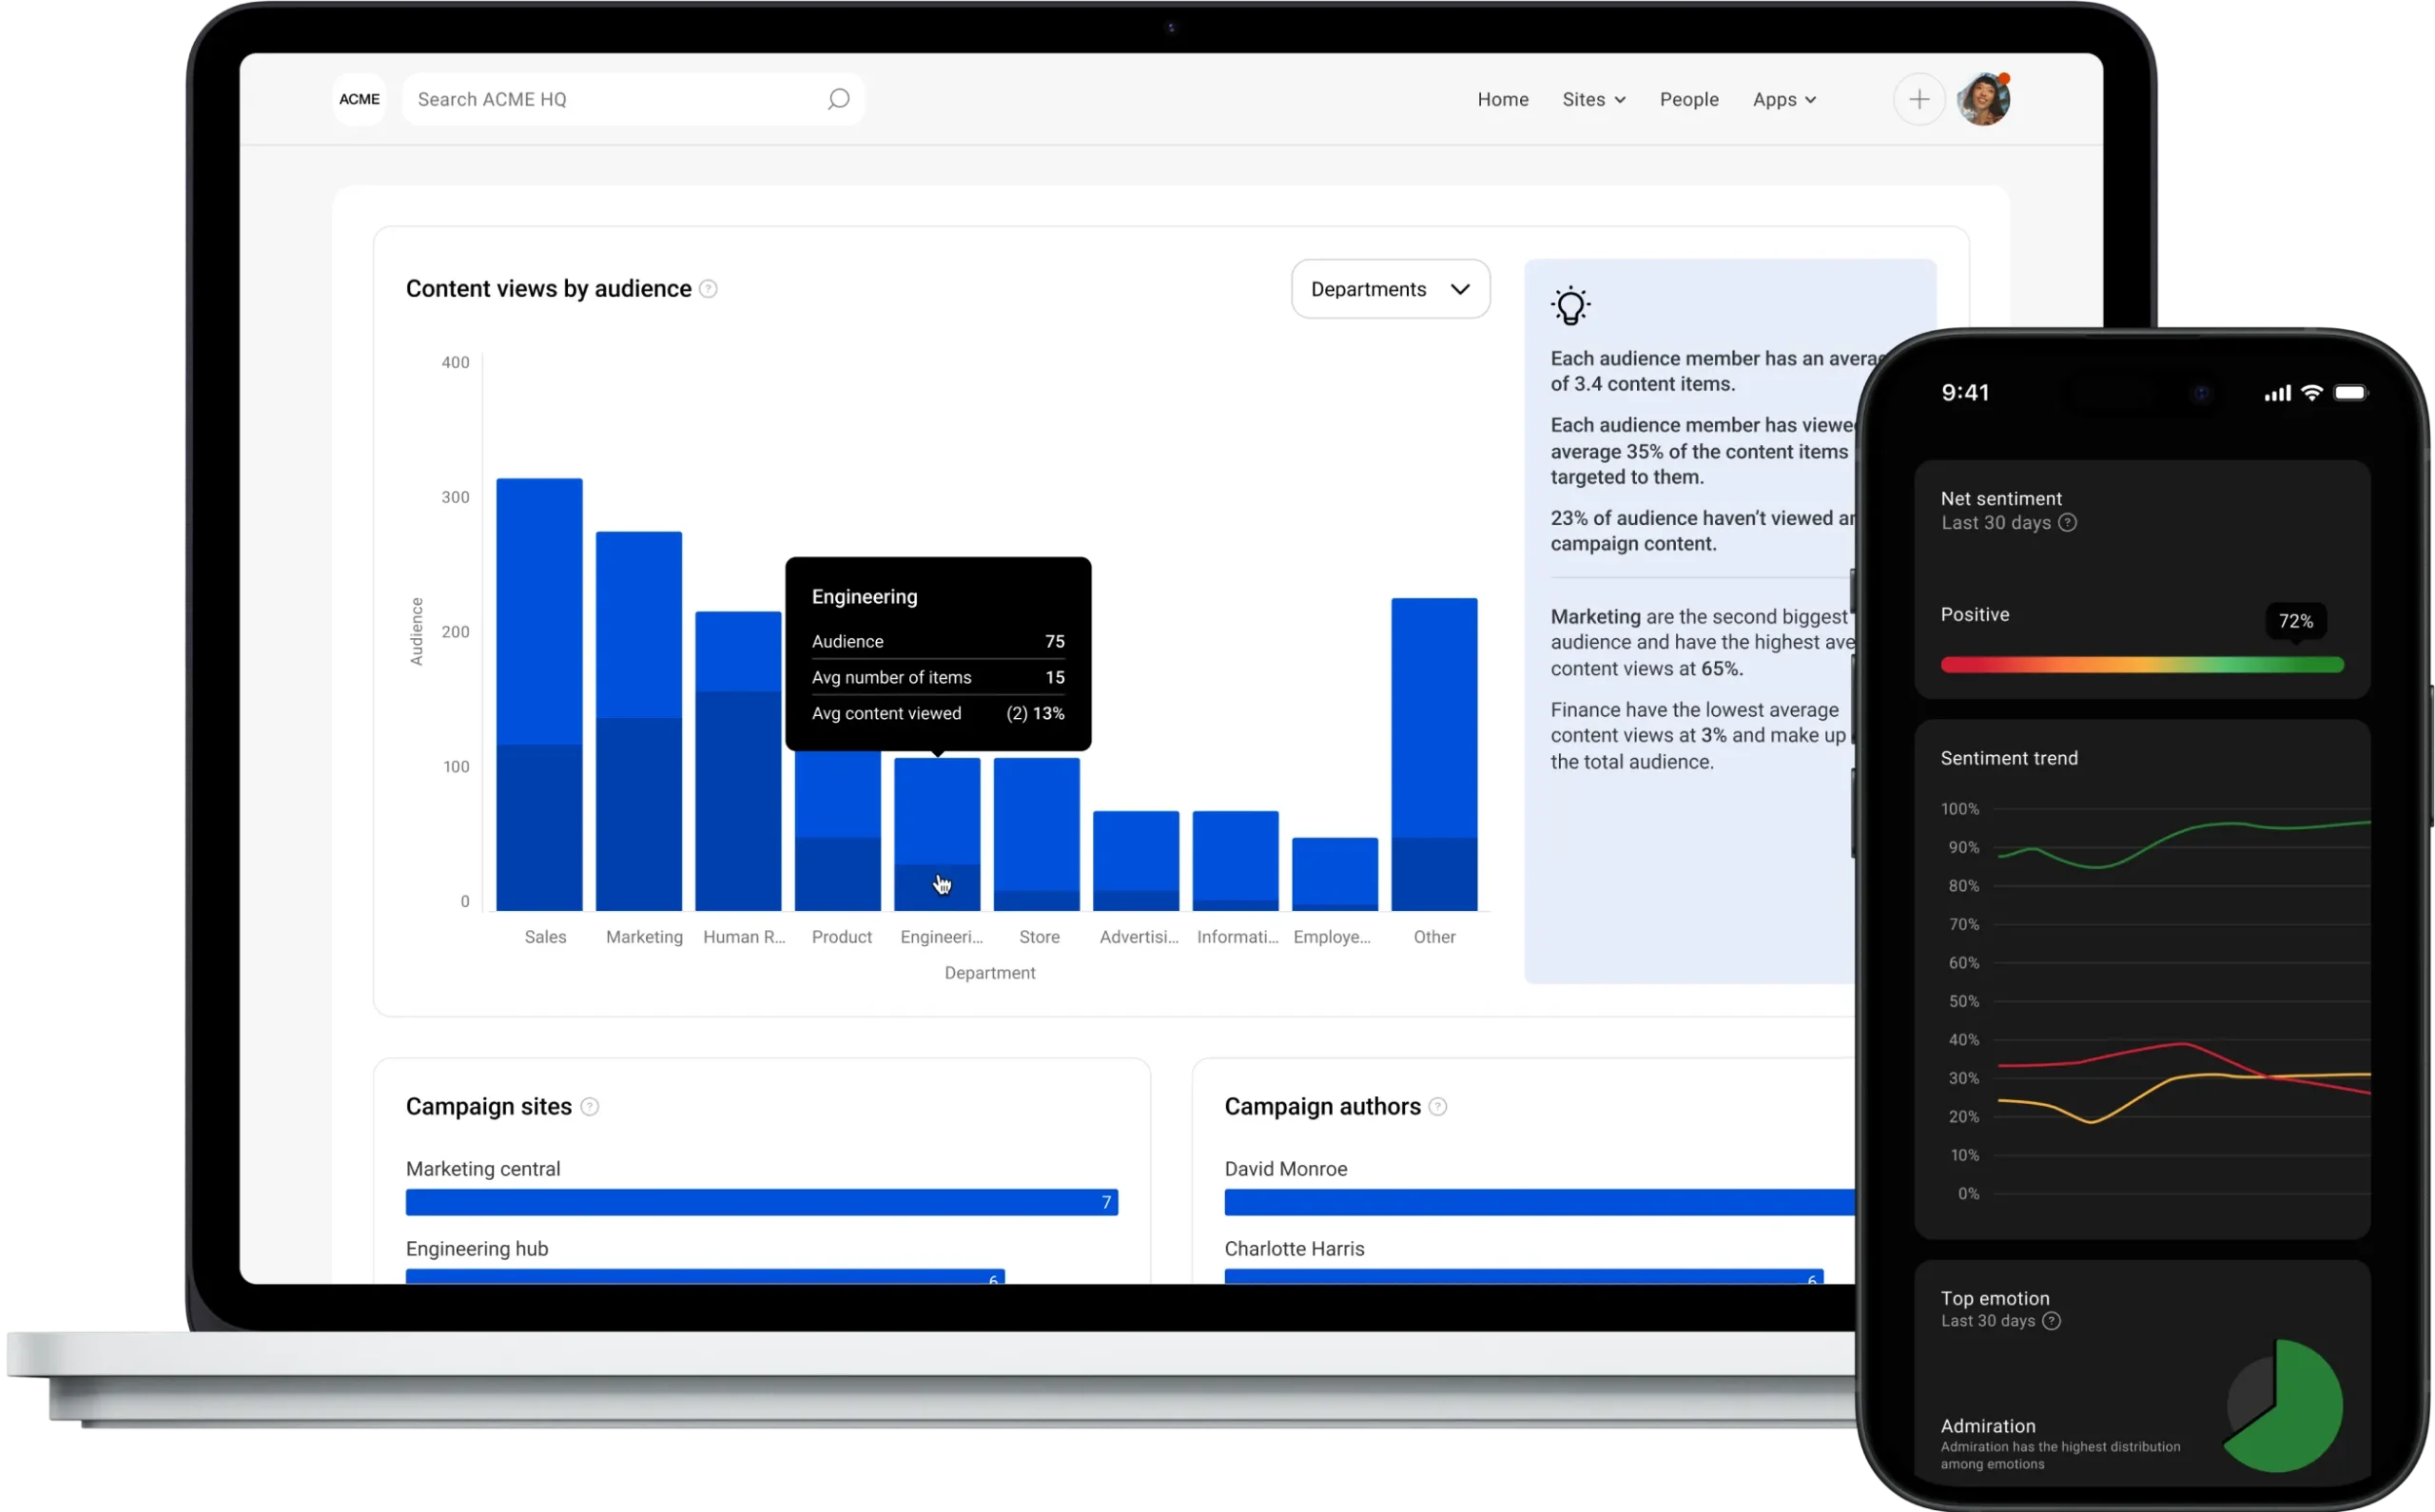
Simpplr surfaces the behavioral signals behind your KPIs. Leaders can see what employees say in surveys as well as how they interact with internal communications, resources, and company initiatives. This helps identify early indicators of disengagement such as declining content engagement, reduced participation, uneven communication reach across teams — before they show up in turnover data.
The platform translates these insights into action by giving managers real-time, role-based dashboards that highlight trends, flag potential issues, and help prioritize next steps. Instead of waiting for quarterly reports, teams can respond quickly to shifts in engagement, workload sentiment, or communication effectiveness.
Simpplr supports many of the KPIs covered in this guide, including pulse survey trends, digital engagement metrics, recognition visibility, and employee advocacy signals. This helps organizations continuously measure, understand, and improve the employee experience.
Ready to see how Simpplr can help you move from engagement guesswork to data-driven action? Request a demo today.
eNPS scores above 0 are acceptable, above 20 are favorable, and above 50 are excellent, though benchmarks vary by industry. Tech companies typically see higher scores than retail or manufacturing, for example. Focus on your trend over time rather than comparing to a single industry standard.
2. How many employee engagement KPIs should we track?
Start with five to seven core engagement KPIs aligned to your biggest challenges like turnover, productivity, or employer brand. Tracking too many metrics creates noise and dilutes focus, while too few will cause you to miss important patterns.
3. What are the most important employee engagement metrics to track?
The most critical engagement metrics are eNPS (overall sentiment), pulse survey scores (real-time trends), retention rate (talent loss), and digital engagement (daily connection behaviors). These four predict turnover and validate whether initiatives are working.
4. How often should you measure employee engagement?
Run monthly or quarterly pulse surveys (five to 10 questions) for real-time trends and one comprehensive annual survey for deep analysis. Continuous measurement through digital engagement tracking provides ongoing insight between formal surveys.
5. What causes low employee engagement scores?
Low engagement typically stems from unclear goals, inadequate manager support, limited growth opportunities, lack of recognition, unsustainable workload, or misalignment with company mission. Segmenting your KPI data by team and department reveals which specific factors are driving disengagement.