


When you launch an employee survey and see a 45% response rate, is that good news or cause for concern? Without industry benchmarks, it’s impossible to know whether your participation levels signal strong engagement or reveal underlying trust issues that need immediate attention.

Survey benchmarks: understanding survey response rates
Survey benchmarks: understanding survey response rates
Table of contents
- 1 What constitutes a good employee survey response rate
- 2 Average employee survey response rate by type
- 3 Key factors affecting survey participation rates
- 4 Proven strategies to improve survey response rates
- 5 Measuring and benchmarking your survey success
- 6 Implementing employee surveys with Simpplr
Response rates serve as the first indicator of survey health, but interpreting them requires context. A 30% response rate might be excellent for an annual engagement survey at a manufacturing company with predominantly frontline workers, while the same number could signal serious problems for a tech startup’s pulse survey. Understanding survey benchmarks helps you gauge not just participation but also the overall effectiveness of your employee listening strategy.
Low response rates often indicate that the employees most likely to respond are either your most engaged advocates or your most frustrated critics. This skew can lead to misguided decisions that miss the silent majority’s true sentiments, making benchmark knowledge essential for accurate interpretation and strategic action.
What constitutes a good employee survey response rate

A response rate isn’t just a statistic but a verdict on how much your people trust you. High participation shows confidence that voices matter. Low numbers, on the other hand, can be a glaring sign of disengagement, doubt, or even indifference. Benchmarks give you the context, but the real question is: what story is your response rate telling about your culture?
Industry standard benchmarks
It’s important to consider context — such as workforce type, company culture, and the way the survey is communicated — to interpret response rates effectively.
Here is a guide on how response rates line up:
- 70% or higher is generally considered excellent and often seen as a strong indication of engaged employees and a well-promoted survey. This can reflect an interested workforce that trusts the process.
- 60-69% is good and considered acceptable in many cases. It shows a reasonable level of engagement, though there’s always room for improvement.
- 50-59% is acceptable but may require attention. This response rate may signal gaps in communication or employee interest. It’s a point to monitor, especially if it drops over time.
- Below 50% is a red flag that could indicate employee disengagement, distrust in the anonymity of the survey, or a lack of confidence that their feedback will lead to meaningful action. It can also reflect poor promotion or timing of the survey.
When response rates matter most
While you want a high employee survey response rate, 100% could actually be a red flag. Was the survey mandatory, did anyone cheat their team’s response rate, or could it have been sabotaged with fake responses?
A low response rate could indicate that employees don’t trust the leadership or don’t believe their feedback will be acted upon.
This could point to deeper issues like a disconnect between management and staff or a lack of transparency. Companies facing high turnover and/or with large proportions of frontline workers (who might not have access to computers or not be willing to use their own mobile phones) may struggle to achieve higher response rates.
You want to be confident that the feedback is representative of the majority of employees so that any actions you implement are relevant. Future surveys and other methods of capturing employee sentiment will help you to monitor the impact of your actions with the aim of improving questions that scored low.
Average employee survey response rate by type
Below are typical response rates for different employee surveys. Other factors will also affect these, which you can read about below.
Onboarding surveys, 50%-70%
Onboarding surveys gather feedback from new hires about their initial experience with the company, training, and team integration. These surveys usually receive moderate response rates because the timing is crucial — employees may be in the early stages of their employment, and participation may feel like an additional task. However, the feedback can provide valuable insights into improving the onboarding process.
A response rate around 60% is typical. Low response rates could suggest that new employees do not feel engaged with the survey or have not had enough time to provide thorough feedback.
Annual all-purpose surveys, 60%-80%
These surveys tend to have the highest response rates because they are often seen as the most comprehensive and are closely tied to strategic decisions about the organization. Employees tend to value being able to provide feedback on a wide range of topics, from job satisfaction to leadership effectiveness.
In many cases, a response rate of 70% or higher is considered ideal. Lower response rates (below 60%) may indicate disengagement or poor communication about the survey’s purpose.
Employee engagement surveys, 60%-80%
These surveys specifically focus on employee engagement, job satisfaction, and morale. Given that engagement is a key indicator of organizational health, response rates for engagement surveys are usually relatively high because employees are more likely to feel invested in providing feedback about their work experience.
Around 70% is considered a solid response rate. Lower response rates may indicate that employees are disengaged or skeptical about whether their feedback will lead to change.
Pulse surveys, 40%-70%
Pulse surveys are shorter and more frequent, typically focusing on specific, real-time issues or sentiments. The response rates can vary depending on the frequency of the surveys and the perceived relevance of the questions. Because pulse surveys are less comprehensive, employees may be more willing to participate, but they might also feel overwhelmed if surveys are too frequent.
While a 50–60% response rate is typical, response rates above 60% are considered strong, particularly if the survey is well-targeted and employees feel it’s valuable.
Exit surveys, 40%-70%
Exit surveys are typically completed by employees leaving the organization. These surveys can have variable response rates depending on how they are administered (e.g., during an exit interview, via email, or online). Sometimes employees leaving a company are less motivated to complete these surveys, especially if they are leaving due to negative experiences. On the other hand, if employees feel that their feedback could help improve the organization, they may be more likely to respond.
Response rates between 50% and 60% are common. However, responses are sometimes harder to gather for exit surveys, particularly if the departure is abrupt or due to negative reasons.
Key factors affecting survey participation rates
Employee survey participation rates are influenced by a combination of factors, and understanding these can help you design a survey that maximizes engagement. Always test your survey in all formats to ensure it will be the best experience for participants, and also to obtain an average time for completion that you can use in your communications.
Survey design and length
The design and length of your survey are crucial to participation rates. Even well-intentioned employees will abandon surveys that feel overwhelming or poorly structured.
- Optimal length guidelines: To optimize response rates, aim for 5-10 minutes completion time as longer surveys can put people off.
- Question clarity and relevance: Make it easy for people to know what you’re asking, so they can do so quickly. This is also important for action planning — you want there to be no ambiguity around what employees are telling you.
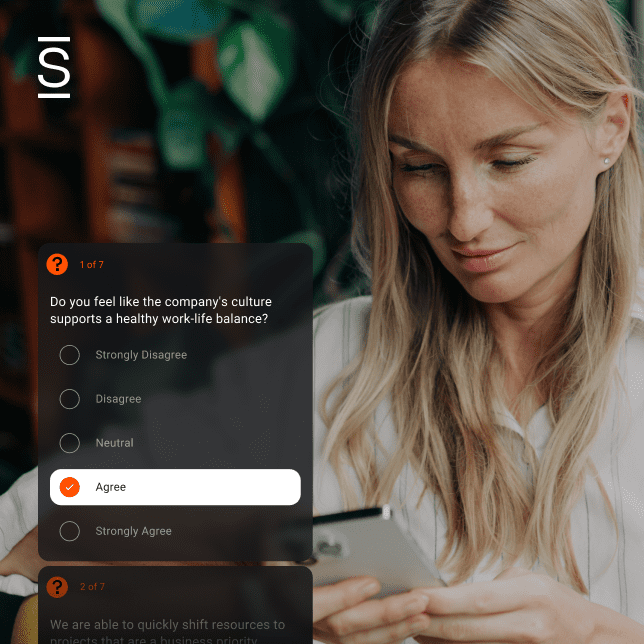
- Mobile-friendly formatting: This is essential, as increasingly employees will access surveys on their phones.
- Progress indicators: This can reduce abandonment rates, because participants know how far they are through the survey.
Audience relationship and trust
Beyond technical design, the human element drives participation more than any other factor. Your relationship with survey participants and their trust in the process often determines whether employees will invest their time in providing honest feedback.
- Internal vs. external audiences: Employed participants may feel a deeper connection to the company and have higher engagement than those who are temporary or contract employees.
- Trust level with surveying organizations: Trust is vital. If employees believe their feedback will be treated confidentially and will be acted on, they are more likely to take part.
- Previous survey experience impact: Related to trust, if employees have seen action taken after previous surveys, they are more likely to consider it a worthwhile activity.
- Perceived value of participation: If employees feel their contribution will make a difference, they are more likely to participate.
Timing and distribution strategy
The timing can have a big impact on your employee survey response rate. Consider any cultural sensitivities and the frequency of surveys, as well as the general topics listed below.
- Day of week optimization: Certain days of the week can see higher participation (often Tuesday to Thursday). Consider having your survey live for two weeks, across three working weeks. You can always extend it to obtain more responses at the end.
- Seasonal considerations: Avoid major holidays, vacation seasons, and busy periods like year-end when employees are focused on deadlines. Sending surveys outside holiday periods will help you to achieve higher participation.
- Follow-up timing strategies: Two reminders for every five working days should be sufficient, with another one on the final day. You will see an increase in responses each time you issue a reminder. Make a note of these so you understand how successful you were to repeat for future surveys.
- Audience targeting: If your survey system has the capability, exclude from reminders anyone who has completed the survey. This will keep them from receiving unnecessary communications.
- Multichannel distribution: Use all your channels to promote your employee survey, such as town halls, team briefs, text, intranet, and email. For frontline teams, ask people managers to allow time in a team meeting to complete the survey, but don’t force participation.
Proven strategies to improve survey response rates
Improving survey response rates is essential to gathering reliable and meaningful feedback from your employees. To encourage higher participation, it’s important to focus on communication, motivation, technical optimization, and follow-up strategies.
Clear communication and transparency
Trust forms the foundation of successful survey participation. When employees understand the purpose and believe their feedback matters, response rates increase significantly.
- Articulate the survey’s purpose: Clearly explain why you are conducting the survey and how the results will be used. Share examples of positive action related to previous surveys. Employees are more likely to engage when they understand the importance of their feedback.
- Commit to sharing results: Assure employees that the results will be shared and highlight how their input will directly influence decisions. Include focus groups for volunteers as part of the analysis if you plan to do this. This creates a sense of involvement and encourages participation.
- Reassure anonymity and confidentiality: Emphasize that responses will remain anonymous or confidential, which helps foster trust and ensures employees feel comfortable providing honest feedback. This is always a concern, so be open with your method to reassure people.
- Engage leadership support: Strong endorsement from leadership can motivate employees to participate. When senior leaders show they value employee feedback, it underscores the importance of the survey. Ensure they mention the survey in all their briefings and meetings while it is live. Also, ensure they have the latest response rate for the company and their part of the business throughout the live period.
Incentive programs and motivation
The most effective approaches consider your company culture and how different reward types will be received by employees. Rewards related to survey completions may cause people to question anonymity, so be sure to communicate how their confidentiality will be protected.
- Offer monetary and nonmonetary rewards: Offer gift cards or charitable donations per completed survey. Nonmonetary rewards might include recognition in company communications or early access to survey results.
- Recognize contributions: Always acknowledge and thank people collectively for their involvement when you share the employee survey response rate. This can boost morale and further encourage participation.
- Provide charitable incentives: Donate a set amount to charity for every completed survey, allowing employees to contribute to a cause while participating. This approach resonates with altruistic employees and can significantly increase response rates.
- Share the results: Offer employees early access to survey summaries or key findings as motivation to participate. This shows that their input is valued and directly influences decisions, though be mindful of which results you share publicly. For example, don’t share something that the business cannot afford to act on, such as more pay or time off.
Technical optimization
Technical barriers are silent participation killers. Ensuring a smooth user experience across all devices removes friction that might prevent employees from completing surveys.
- Design for mobile responsiveness: More employees are completing surveys on mobile devices. Design the survey to be mobile-responsive to provide a smooth user experience across all platforms.
- Ensure multidevice compatibility: Make sure the survey is accessible on various devices (smartphones, tablets, laptops). A consistent experience across platforms reduces barriers to participation.
- Optimize load times: Slow load times can frustrate participants and lead to high abandonment rates. Optimizing the survey’s load time ensures a seamless experience, keeping participants engaged.
- Implement save-and-continue functionality: Allow participants to save and continue their responses later. This is especially useful for longer surveys, ensuring employees don’t abandon the process due to time constraints.
Strategic follow-up approaches
Effective follow-up balances persistence with respect for employees’ time. The right timing and messaging can significantly boost response rates without creating survey fatigue.
- Send timely reminders: Space out reminder emails to prompt action without overwhelming employees, e.g., launch on Tuesday, then remind each Friday and Tuesday. A series of well-timed reminders can help nudge those who haven’t responded yet.
- Personalize email messages: Tailor all your survey emails to individuals rather than sending generic messages. Personalized messaging helps employees feel valued and reminds them of the importance of their participation.
- Leverage multiple channels: Use a mix of communication channels — email, intranet, text, town halls, and team meetings — to increase visibility and make it easy for employees to access the survey.
- Extend the survey deadline: If response rates are lower than hoped, consider extending the deadline. An extension, especially with a friendly reminder, can boost participation and ensure a higher quality of data.
Companies with large frontline workforces can boost participation by providing dedicated survey time during shifts, setting up tablets or kiosks in break rooms, and offering paper survey options. For high-turnover environments, shorter pulse surveys and simplified language work better than lengthy annual surveys.

Measuring and benchmarking your survey success
Understanding your response rates is only the beginning. Tracking the right metrics over time reveals whether your survey strategy is truly working. Effective measurement goes beyond counting responses to assess engagement quality and identify improvement opportunities.
Response rate calculation methods
Before you can benchmark your success, you need consistent methods for calculating participation rates. These foundational metrics help you compare results across different surveys and time periods.
- Standard calculation formulas: Divide the number of completed surveys by the number of people invited, and multiply the result by 100 to obtain your response rate as a percentage.
- Partial completion considerations: Consider tracking partial completions to assess how much of the survey content employees started but didn’t finish. If a significant number of people stop at the same point, this may indicate a technical issue or a topic of no value to participants.
- Qualified respondent definitions: Establish clear criteria for what constitutes a valid response in your calculations. For example, you might count only surveys that are at least 60% complete, or require that key demographic questions are answered to include the response in your final analysis.
Tracking and improvement metrics
Raw response rates tell only part of the story — comprehensive tracking reveals patterns that guide future improvements. The most valuable insights come from analyzing trends, completion patterns, and engagement quality over time.
- Response rate trends: Tracking response rates over several surveys helps identify patterns and gauge the effectiveness of your engagement strategies. A steady increase in participation suggests successful efforts in improving engagement.
- Completion rate analysis: Alongside response rates, measuring completion rates (the percentage of respondents who finish the survey) is essential. Low completion rates may indicate issues with survey length or question clarity. Stringent testing before launch can help mitigate this.
- Engagement quality indicators: Simply collecting responses isn’t enough. You need to assess the quality of engagement. For example, are employees providing thoughtful, detailed answers, or are responses rushed and generic?
- Demographic response patterns: Segmenting your response data by demographic factors (e.g., department, location, or tenure) allows you to identify whether certain groups are underrepresented or less engaged. This can help tailor future surveys to ensure a more balanced representation.

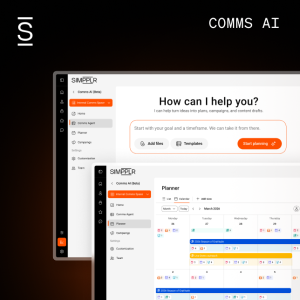
Implementing employee surveys with Simpplr
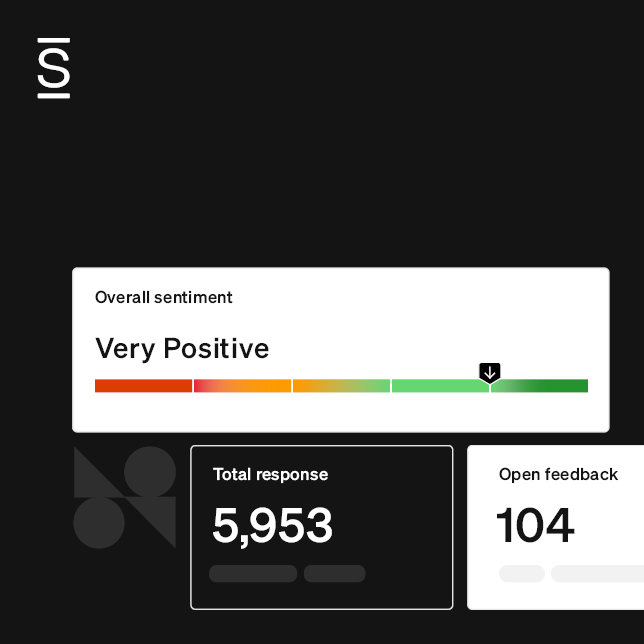
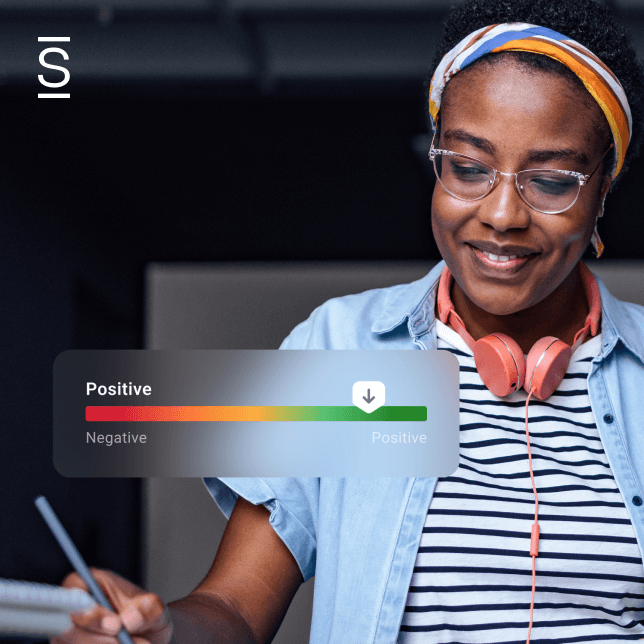
Employee surveys are valuable tools, but they measure only a single point in time. Simpplr expands your employee listening strategy by augmenting surveys with sentiment analysis, AI-driven insights, and passive listening across communication channels. This gives leaders actionable insights to elevate the employee experience.
Simpplr empowers you to centralize employee surveys, sentiment, engagement, and insights in a single, unified employee engagement platform.
With Simpplr’s employee survey solution, you can:
- Turn responses into action: Combine survey feedback with ongoing listening to identify themes, trends, and attitudes, giving leaders a complete view of workforce dynamics.
- Unify the employee experience: Deploy surveys across the same intranet experience employees already use to connect and engage, ensuring high participation and inclusivity.
- Streamline survey management: Target, manage, and schedule surveys across multiple channels with ease, ensuring high participation and inclusivity.
- Amplify impact with AI insights: Translate raw feedback into actionable intelligence that guides decision-making and strengthens retention.
By combining surveys with AI-powered analytics and multichannel communication, Simpplr helps you not only listen to employees but also truly understand and respond to them. That’s how you transform engagement from a snapshot into a sustainable strategy.
Ready to see how Simpplr’s AI-powered employee surveys can increase engagement? Request a demo today.

Watch a 5-minute demo
See how the Simpplr employee experience platform connects, engages and empowers your workforce.
- #1 Leader in the Gartner Magic Quadrant™
- 90%+ Employee adoption rate