






TL;DR: To measure employee recognition, track three KPI categories: participation, distribution, and business impact. Capture a 90-day baseline, review results on a fixed cadence, and tie the data to outcomes leaders fund, such as retention.

How to measure employee recognition: KPIs, framework, and ROI
How to measure employee recognition: KPIs, framework, and ROI
Table of contents
- 1 Why measuring employee recognition matters
- 2 Employee recognition KPIs to track
- 3 A framework for measuring employee recognition program success
- 4 How to estimate recognition program ROI
- 5 Common mistakes when measuring employee recognition
- 6 Make recognition measurement part of the operating rhythm
A recognition program usually starts with great excitement, backed by a budget, a leadership kickoff, and a dedicated employee recognition platform. Over time, posts accumulate, and points are redeemed, but without clear success metrics. When leadership asks about the program’s return on investment, HR struggles to provide a compelling answer.
Understanding how to measure employee recognition can help fix this problem. A defined KPI set, a fixed reporting cadence, and an honest baseline can turn a feel-good initiative into an employee recognition program HR can defend. This guide covers three KPI categories, a four-step framework, and a way to frame ROI that holds up in a leadership review.
Why measuring employee recognition matters
Without measurement, HR can’t show leadership what a recognition program is achieving or which teams it misses. Without that visibility, gaps can persist even when the program appears successful overall.
The link between employee recognition and retention
Employees do their best work when they feel valued and appreciated. When recognition is missing, engagement drops and turnover follows. Without meaningful acknowledgment, even the most dedicated employees may lose motivation and seek opportunities elsewhere.
Timely, consistent recognition reinforces positive behaviors and keeps employees motivated. Employees who feel seen at work have one less reason to update a resume. That feeling grows when recognition shows up week after week. Simpplr’s Recognition and Reward makes it easy to keep appreciation visible, consistent, and tied to the values that define your culture.

Where recognition measurement usually breaks down
Recognition measurement usually breaks down when teams count what is easy and skip what explains employee behavior. Redemption totals and post counts are simple to pull from a dashboard, but they rarely show who is left out or why.
Four blind spots show up again and again:
- Treating reward redemption counts as a stand-in for employee engagement
- Leaving manager participation out of program reporting entirely
- Measuring employee recognition activity with no link to an outcome metric
- Reporting companywide averages that mask department-level trouble
Recognition data often lives in a separate tool from engagement, communication, and survey data, so a drop in recognition on one team rarely gets read alongside what else is happening there.

Employee recognition KPIs to track
A busy recognition feed tells HR that people are using the program. It doesn’t show whether participation lasts beyond a launch campaign, whether recognition reaches every team, or how it relates to engagement and retention.
To understand those differences, track three groups of employee recognition KPIs: participation, distribution, and business impact. Each group answers a different question leaders may ask.
Every metric below includes a plain definition, and most include a simple formula. Treat the numbers in this guide, such as the 60-day no-recognition flag, as starting points. Test them against your own data before turning them into targets.
| KPI category | Metrics to track | Why measure them |
|---|---|---|
| Participation and engagement | Giving rate, receiving rate, repeat giving, time to first recognition | Shows whether recognition has become a habit |
| Frequency and distribution | Recognition frequency, recipient coverage, manager participation, concentration | Shows how consistently recognition reaches eligible employees |
| Business outcomes | Voluntary turnover, eNPS, engagement survey scores | Shows how recognition relates to broader employee outcomes |
Participation and engagement metrics
Participation metrics show who gives and receives recognition and whether participation continues over time. Measure recognition actions separately from general platform usage, such as intranet logins or content views.
- Giving rate: Unique employees who gave at least one recognition during the period, divided by eligible employees, multiplied by 100.
- Receiving rate: Unique employees who received recognition during the period, divided by employees eligible to receive, multiplied by 100.
- Repeat giving rate: Percentage of prior-period givers who also gave recognition in the current period, using consistent eligibility rules.
- Time to first recognition: Days from a new hire’s start date to their first recognition received. Report this alongside the percentage of new hires who remain unrecognized.
Time to first recognition is an early-tenure signal. HR can act on it by prompting managers during the first 30 days of new-hire onboarding, when first impressions are still forming.
Review peer and manager participation separately. A gap between giving and receiving rates prompts an examination of eligibility, access, and program design. Recognition supports company culture most when peers recognize each other as often as managers do.
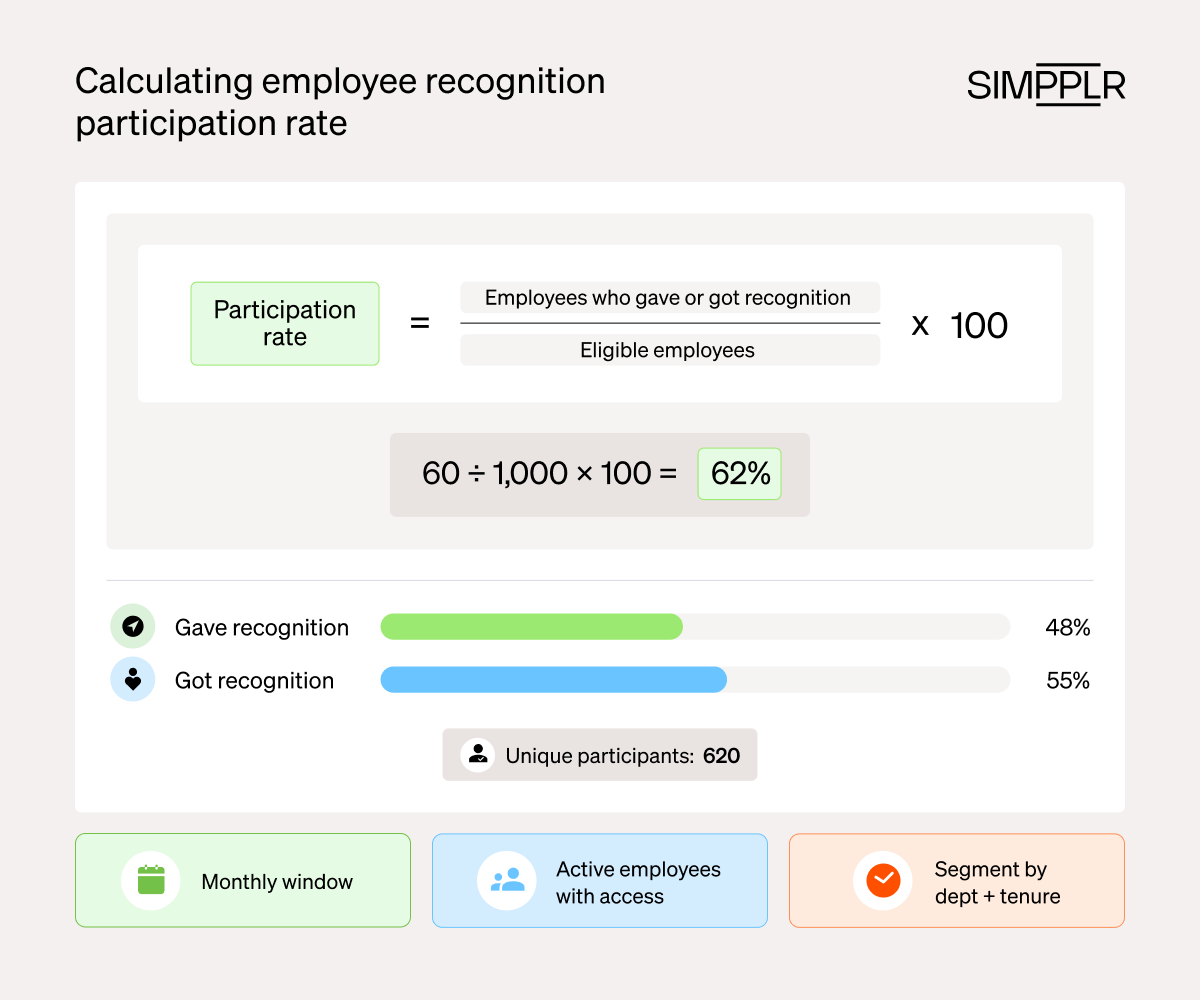
How to calculate recognition participation rate
- Formula: Unique eligible employees who gave or received recognition, divided by the eligible population in the reporting scope, multiplied by 100.
- Example: If 620 of 1,000 eligible employees participated, the rate is 62%.
- Counting rule: Count each employee once, including employees who both gave and received recognition.
- Measurement window: Report monthly and review longer-term trends to identify seasonal or campaign-related spikes.
- Eligibility: Apply consistent rules for program eligibility, leave, and new hires.
- Segmentation: Compare results by department, location, and tenure.
Recognition frequency and distribution metrics
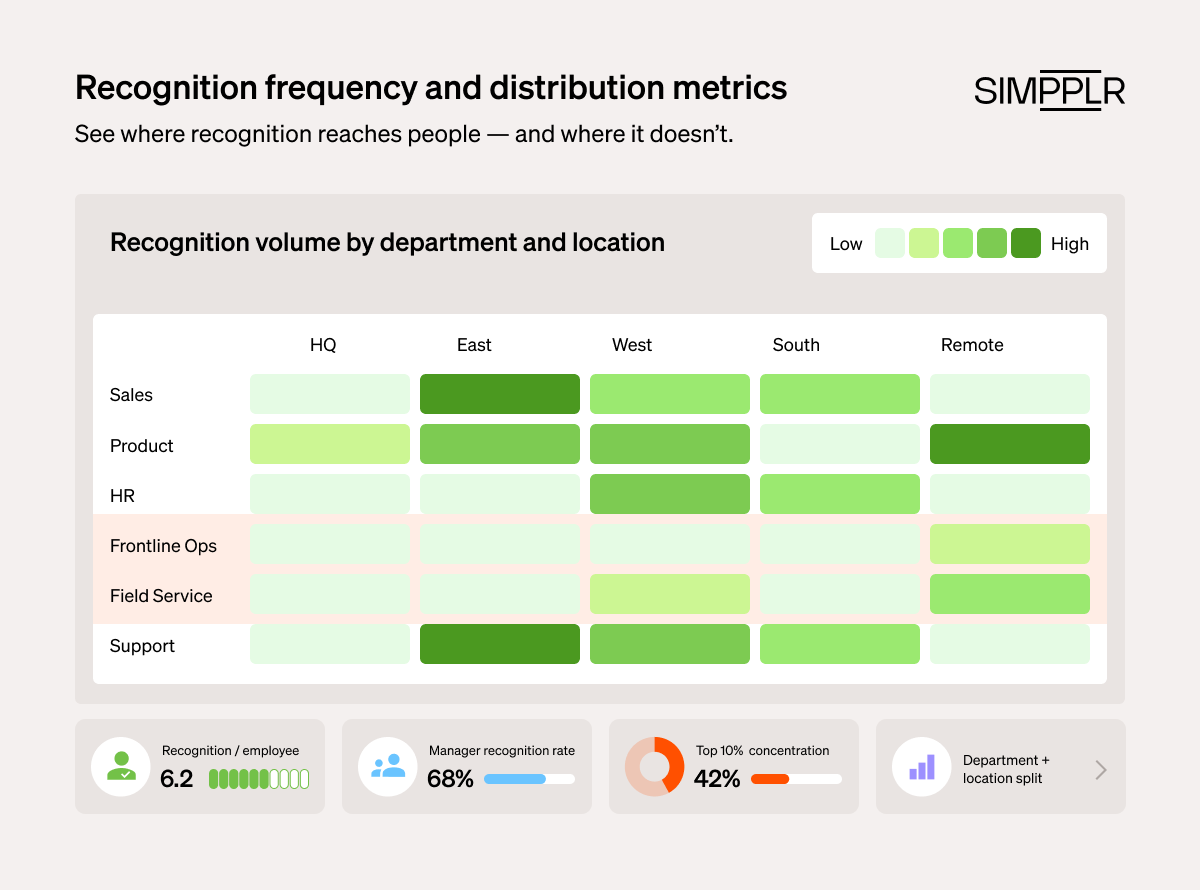
Distribution metrics show where recognition lands across the organization. Even with high overall participation, recognition can skip entire teams. Tracking these metrics helps ensure the program reaches everyone fairly.
Track these distribution metrics:
- Recognition frequency per employee: Recognitions received during the period, divided by eligible employees. Report giving frequency separately and count group recognition consistently at the recipient level.
- Recipient coverage: Unique employees recognized within a group, divided by eligible employees in that group, multiplied by 100. Compare coverage by department, location, and seniority.
- Manager participation rate: Eligible people managers who recognized at least one direct report during the period, divided by eligible people managers with direct reports, multiplied by 100.
- Recognition concentration: Share of recipient-level recognition received by the top 10% of recipients during the period.
- Value alignment: Share of recognitions tied to a company value, a simple proxy for quality.
Uneven distribution often signals recognition program decline. Clustering recognition around headquarters or specific teams deepens visibility gaps and erodes trust— especially for remote, hybrid, and frontline employees who frequently miss corporate feeds.
Review manager participation and direct report coverage together. A benchmark, such as no recognition in 60 days, highlights overlooked contributions. If participation drops, examine access, eligibility, and leadership involvement.
For programs with rewards, evaluate points given, redemption activity, and budget usage separately. Low redemption may stem from low awareness, limited reward relevance, or saving for larger items—it does not inherently mean disengagement. Keep point allowances, points redeemed, and financial costs distinct when analyzing results.
Business outcome metrics
Business impact metrics connect employee recognition data to outcomes leadership already tracks each quarter. These numbers carry the most weight in budget conversations, so teams need to frame them carefully.
Track these business impact metrics:
- Voluntary turnover rate: Voluntary exits divided by average headcount during the observation period, multiplied by 100. Compare groups using recognition received in a preceding period.
- Employee net promoter score (eNPS): Percentage of promoters minus percentage of detractors.
- Engagement survey scores: Employee survey items on feeling valued and on manager relationships.
Recognized employees may show lower turnover and higher engagement, but pay, workload, and manager quality also matter. Recognition is one contributing factor among several, and reports should say so. Measure recognition before the turnover observation period and compare groups with similar roles, tenure, and locations.
HR teams presenting recognition results to leadership can say, “Comparable employee groups with higher recognition participation had X% lower voluntary turnover in the following period than groups with lower participation.”
This comparison shows a relationship between recognition participation and voluntary turnover; further evidence is needed to establish whether recognition caused the difference.

A framework for measuring employee recognition program success
Without a baseline or regular review schedule, leaders won't trust recognition data. Involving internal comms teams in these reviews also helps align recognition with intranet metrics.
Align recognition goals to existing HR objectives
Recognition KPIs land better when they connect to goals leadership already funds. A program tied to an existing business goal reads as part of the annual people plan. That can make its budget far easier to protect.
Strong candidates include retention in a high-attrition function, engagement scores in a specific region, or the onboarding experience for new hires. HR teams do well to pick one or two, since a program chasing every goal may move none of them.
For instance, a hospital network losing night-shift nurses can tie recognition targets to 12-month retention in those units. That way, the program tracks a key metric that executive leadership already reviews closely.
Establish a baseline and refine targets
Set program objectives at launch and use available historical data to establish the starting point. For a new employee recognition program, use an initial observation period, such as 90 days, to understand participation patterns and refine numerical targets. Then, record seasonal or organizational changes that affect comparisons.
A useful baseline covers four numbers:
- Participation rate: Split by giving and receiving to track two-way engagement.
- Manager participation rate: Share of managers who gave recognition, tracked by business unit and region.
- Recipient coverage: Share of eligible employees receiving recognition, compared across teams and regions.
- Outcome metric: The current value executives will use to judge success.

Pair quantitative KPIs with qualitative context
Quantitative data shows patterns; employee feedback helps investigate possible explanations. Ask employees whether recognition feels specific, timely, fair, and meaningful, and review their responses alongside employee metrics such as participation and distribution trends. A short pulse survey with an open-text field works well for this.
Review which company values appear in recognition and whether messages explain the contribution being celebrated. Higher activity alone does not establish a better recognition experience.
If manager participation falls in one region, feedback might point to a recent reorganization or changes in workload. Text and sentiment analysis help identify recurring themes for further investigation.
Listening sessions with frontline teams add context about access, relevance, and day-to-day experience that employee surveys can miss. That pairing is much easier when recognition and survey data live in one system instead of separate tools.
Set a reporting cadence and stakeholder rhythm
A monthly operational review keeps the program team aligned with the data. Include internal comms in this meeting, as they manage the intranet data that sits alongside recognition metrics.
A quarterly report keeps executives informed without overwhelming them. A clear three-column structure is more effective than a lengthy data export.
What to include in a quarterly recognition report
- KPI: The metric and its current value, stated in plain numbers anyone can read.
- Trend: The direction and size of change against the baseline and the prior period.
- Action: What the team will do about the number before the next quarterly review.

How to estimate recognition program ROI
An ROI estimate combines an assumption about recognition-attributable financial benefits with total program costs. To show employee recognition program ROI to leadership, compare turnover costs for recognized employees and for everyone else, then weigh the difference against what the program costs.
Framing it in finance’s own numbers helps secure buy-in and protect a budget leaders often treat as optional.
Build the estimate in five steps
- Define the comparison: Measure recognition during one period and turnover during a subsequent period. Compare employee groups with similar roles, tenure, and locations.
- Estimate the turnover-cost difference: Multiply the observed turnover-rate difference by the relevant headcount and an internal cost-per-departure figure agreed with Finance. Pull recruiting, onboarding, and ramp-time costs from Finance to build that figure.
- State attribution assumptions: Explain what share of the estimated benefit is being attributed to recognition and why. Test a range of scenarios.
- Calculate program costs: Include relevant software, rewards, implementation, and administration costs over the same period.
- Calculate estimated ROI: Subtract total program costs from estimated attributable benefits, divide by total program costs, and multiply by 100.
Estimated ROI = (Estimated attributable benefits − Total program costs) ÷ Total program costs × 100
For example, a turnover rate four percentage points lower in a group of 300 employees corresponds to a difference of 12 exits. At $40,000 per departure, that represents a modeled turnover-cost difference of $480,000.
This estimate helps build a credible ROI case for recognition, especially in a people plan built around retention. Work with Finance to assess recognition’s contribution to the potential savings and include program costs in the ROI estimate.
Common mistakes when measuring employee recognition
A solid employee recognition KPI framework can still fail when teams misread the data. These four mistakes often appear in the first year after launch, and each has a simple fix.
Treating activity as proof of engagement
Recognition totals and reward redemptions are useful operational measures, but they do not establish employee engagement on their own. Review them alongside participation, distribution, and employee feedback to understand how the program is being used and where the experience warrants attention.
Overlooking manager recognition data
Managers shape how employees experience recognition within their teams. HR teams should track manager participation separately in recognition reports and program reviews to identify managers who may need support recognizing employee contributions.
Measuring the program without measuring who it misses
High-level employee participation averages can mask blind spots. A program can look successful on paper even when an entire department or regional office receives almost no recognition. Distribution and concentration metrics bring those teams back into view, often starting with frontline and night-shift crews.
Changing KPIs every quarter
Swapping metrics midyear resets your baseline, making year-over-year comparisons impossible. Keep core KPIs consistent for at least a year so real trends emerge and leadership learns to trust the data.
Make recognition measurement part of the operating rhythm
Recognition programs stay credible when they report on a steady cadence. Use each review to identify gaps, test improvements, and assess progress. Connect every KPI to its trend and a practical action, and keep observed outcomes separate from claims of causation. Start this rhythm this quarter, so your numbers are ready whenever leaders ask.
How Simpplr helps you measure employee recognition
Simpplr brings employee recognition and rewards into the everyday employee experience, alongside the communications and content employees already read on the intranet.
Recognition analytics help admins review participation, activity trends, company values, and rewards, with filters such as department and location to investigate differences across the organization.

Managers gain visibility into team recognition and employees who have not been recognized recently, helping them identify contributions that may be overlooked. For organizations using Rewards, reporting on points given and redeemed adds visibility into reward activity.
Pair these operational insights with employee feedback from surveys and sentiment analysis, plus HR outcome data, to assess program effectiveness and investigate opportunities for improvement. Prescriptive analytics add context on why a KPI moved.
Explore how Simpplr brings recognition, rewards, and program insights into one employee experience. Request a demo today!
Watch a 5-minute demo
See how the Simpplr employee experience platform connects, engages and empowers your workforce.
- #1 Leader in the Gartner Magic Quadrant™
- 90%+ Employee adoption rate