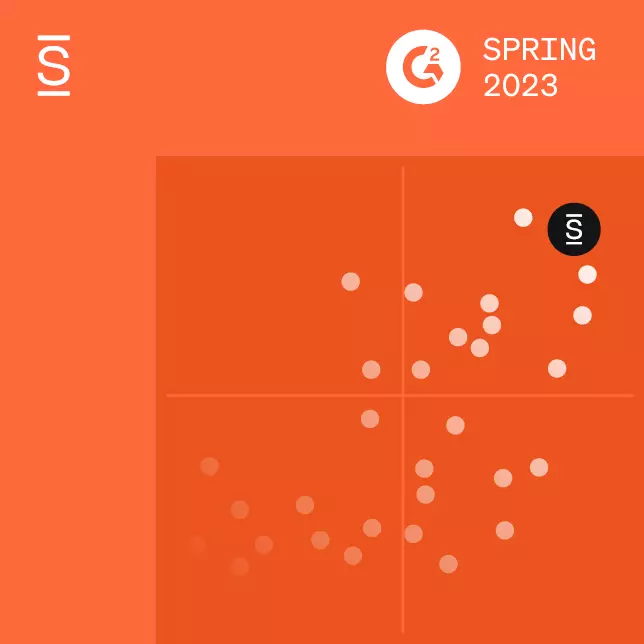





The G2 Fall Employee Intranet Report ranks intranet platforms based on verified user reviews and market data. It evaluates customer satisfaction and market presence to help you choose the best provider, prioritizing successful deployment and implementation.

Find the right G2 intranet leader with the Fall 2026 report
Find the right G2 intranet leader with the Fall 2026 report
Employee intranet evaluations usually end with two or three platforms that look equally capable on paper. Differentiating them requires data from organizations that already completed the deployment. If you’re looking for a reliable Intranet solutions provider, the G2 report should be a helpful guide to filtering your options.
Every month, upwards of 6 million prospective software buyers browse the G2 platform to find credible, authentic reviews.
Understanding the G2 Fall 2026 Report
Before diving into the leaderboards, it helps to understand the data-driven framework that powers these rankings.
How does G2 compare various intranet solution providers?
Every quarter, G2 analyzes and ranks the best employee intranet software solutions. G2 rates each product algorithmically, so no single analyst decides where a platform lands. The Fall 2026 report is built on reviews collected through July 28, 2026.
G2 considers two parameters before any score:
- A product needs at least 10 reviews from real users of that product.
- A product has to pass G2’s published categorization methodology to meet category standards.
It then applies two scores to the data it holds:
- Customer satisfaction: Comes from verified user reviews, covering ease of use, quality of support, ease of setup, and how well the product meets requirements.
- Market presence: Comes from third-party data, including seller size, employee count and social reach.
Each product is then placed into one of four groups: Leaders, High Performers, Contenders and Niche.
- Leaders: Boast high ratings from G2 users and hold substantial market presence scores.
- High performers: Earn high customer satisfaction scores and lower market presence compared to the rest.
- Contenders: Hold high market presence with relatively low customer satisfaction scores, and carry too few reviews to validate those ratings.
- Niche brands: Score on both satisfaction and market presence, with insufficient reviews to validate their ratings.
Beyond placement, G2 publishes the details behind each score. The report breaks every platform down by feature rating, implementation method, average months to go live, deployment model, customer size mix and median number of users purchased.
That detail is what makes the report credible during a technical evaluation rather than a summary to skim.
What do the numbers say?
G2 publishes feature and implementation data for every rated platform. The below measures explain most of the differences between a rollout that finishes and one that stalls.
| Measure | What the report shows | Why it matters |
|---|---|---|
| Performance & Reliability | Top platforms clear 90%; others lag | Uptime under full load |
| Access Management | Rare to top 90%; most large vendors score in 80s | Scaling permissions as headcount changes |
| User Directory | 6-7 point gap between top and mid platforms | Accuracy after sync |
| Cloud Deployment | Varies from 41% to 79% among top providers | Level of hosting autonomy |
| Time to Go-Live | Large orgs range 3.4-4.9 months | Rollout speed variance |
| Consultant Dependency | Projects range from 1% to 5% external involvement | Implementation independence |
Simpplr is named a G2 Intranet Leader in the G2 2026 Fall Report, scoring above the leaders average on platform reliability, access management and time to go live.
What does the G2 Fall report 2026 say?
The Fall 2026 report reveals that top performance is limited to a few platforms. The key differences between them often lie in the areas where rollouts succeed or fail.
Category size does not predict satisfaction
Many large vendors have strong brand recognition, yet their user satisfaction scores are often below average. A popular name does not guarantee that the platform will perform well once deployed.
Reliability and access management separate the top tier
Scoring above 90% in multiple parameters is rare. While some platforms excel in reliability, fewer master user access management. Most large-scale vendors score in the 80s, which can make it difficult to manage permissions as your headcount changes.
Implementation effort varies more than feature sets
While feature ratings are similar among top platforms, implementation data varies significantly. For Leaders serving large organizations, go-live timelines range from 3.4 to 4.9 months, and consultant involvement fluctuates between 1% and 5%.
Hosting responsibility still differs widely
Cloud adoption among Leaders varies widely, from 41% to 79%. Lower percentages indicate that customers must manage their own infrastructure, including patching and scaling.
Reviewer profile changes what a score means
Customer size mix varies significantly. Some platforms rely primarily on small-business reviews, which may not accurately reflect enterprise-scale needs.
What does this mean for your intranet selection decision?
Use this report to filter options before you start demos. The below checks will help you build a shortlist that can pass a technical review.
Read satisfaction and market presence separately
Running both scores as one filter is how a large vendor ends up on a shortlist it should never have reached, so split them.
- Sort the category by satisfaction first, then check market presence as a secondary filter.
- Cut any platform that scores high on presence and below the category on employee survey and satisfaction.
- Keep the two columns separate in your evaluation sheet so a large vendor never enters the shortlist on name recognition alone.
Treat go-live time as a resourcing number
Vendor proposals are estimates, but this report provides real-world data from customers who have already completed their implementations.
- Pull each shortlisted platform's go-live average from the report before the first demo.
- Put that number in front of the vendor and ask them to reconcile it against their proposed timeline.
- Ask which customers hit the faster number and what they did differently, if the gap runs over a month.
Simpplr customers report an average go-live of 3.4 months, against 4.8 and 4.9 months for the other G2 intranet leaders serving large organizations. See how Simpplr handles implementation.
Check who does the implementation work
A platform can rate well on every feature and still hand a third of the rollout to an outside firm, which the implementation breakdown will show.
- Note the third-party consultant percentage for every shortlisted platform.
- Ask the vendor to name the partner and quote the engagement.
- Confirm whether the vendor's own services team can complete the work instead.
Confirm the deployment model matches your architecture
Cloud share is the fastest way to see whether a vendor's customers actually run the hosted version or end up managing infrastructure themselves.
- Check the cloud figure against what your security review will approve.
- Ask which deployment the vendor's reference customers chose, if the figure runs low.
- Confirm the cloud option carries the same feature set as the on-premises one.
Weigh reliability and access management above feature counts
Building feature matrices takes weeks and rarely differentiates top finalists. You can get better insights by focusing on reliability and access management ratings.
- Set a floor of 90% on performance and reliability and on user, role and access management.
- Drop every platform below that floor before comparing features.
- Run feature comparisons only on what survives the cut.
Simpplr rates 92% on performance and reliability and 91% on user, role and access management in the Fall 2026 report, making it a reliable G2 Intranet Leader. Read Simpplr customer testimonials.
Why is Simpplr named a Leader in the 2026 G2 Fall Report?
G2 named Simpplr a Leader due to our high customer satisfaction and strong market presence. This ranking is supported by strong user feedback.
98% of reviewers gave us 4 or 5 stars, 97% say our product is heading in the right direction, and 92% would recommend us.
Moreover, Simpplr scores above the category average on every satisfaction rating G2 measures:
| No. | Metric | Simpplr Score | Category Average |
|---|---|---|---|
| 1 | Ease of doing business with | 95% | 92% |
| 2 | Quality of support | 94% | 91% |
| 3 | Ease of use | 94% | 91% |
| 4 | Meets requirements | 91% | 90% |
| 5 | Ease of admin | 91% | 89% |
| 6 | Ease of setup | 89% | 88% |
Simpplr, a G2 Intranet Leader, rates 91% on user, role and access management and reaches go-live in an average of 3.4 months, with third-party consultants involved in 1% of implementations.
Beyond intranet software, Simpplr is recognized in categories like employee engagement, communications, and social networking. Our user base is primarily concentrated in the IT, software, and financial services sectors.
More than 1,000 organizations run Simpplr's employee experience platform. Here are some of our key capabilities:
- Unified employee experience in a single platform
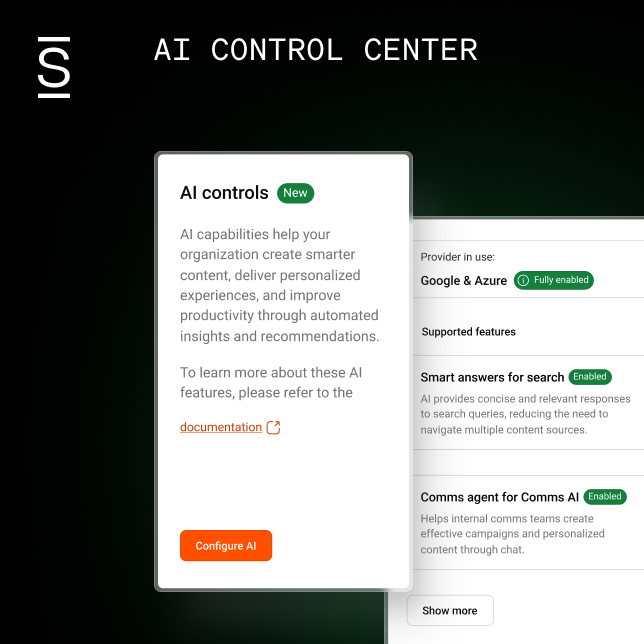
- Context-aware, responsible AI personalizes the employee experience with relevant, real-time information
- Award-winning UX ensures rapid deployment, effortless use and easy maintenance
- AI-powered search for instant answers across all enterprise data, unlocking company knowledge
- Unrivaled security with enterprise-level encryption
- 5X above industry adoption across more than 2M active users and 1,000+ global customers
- Scalable, flexible and extensible with over 200+ integrations and APIs
- Only employee intranet platform that provides clear, unified and actionable insights to drive higher engagement and productivity
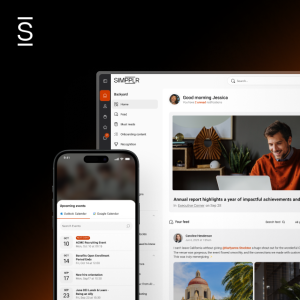
Ready to see Simpplr intranet platform in action? Book a demo today.
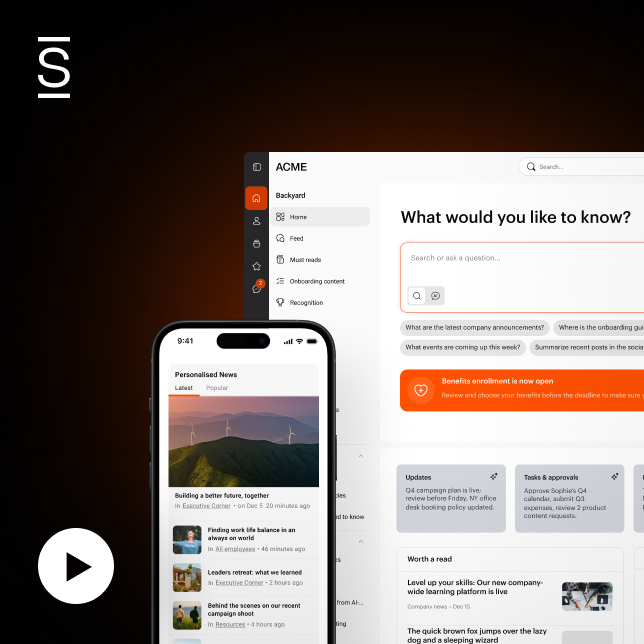
Watch a 5-minute demo
See how the Simpplr employee experience platform connects, engages and empowers your workforce.
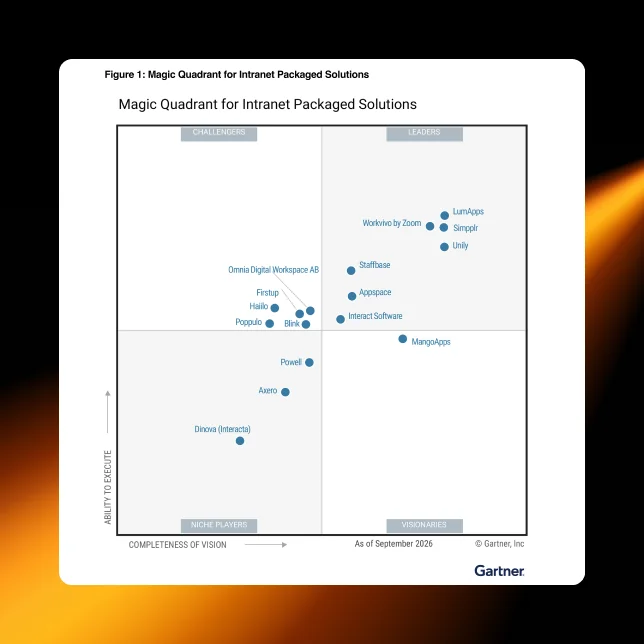
- #1 Leader in the Gartner Magic Quadrant™
- 90%+ Employee adoption rate